
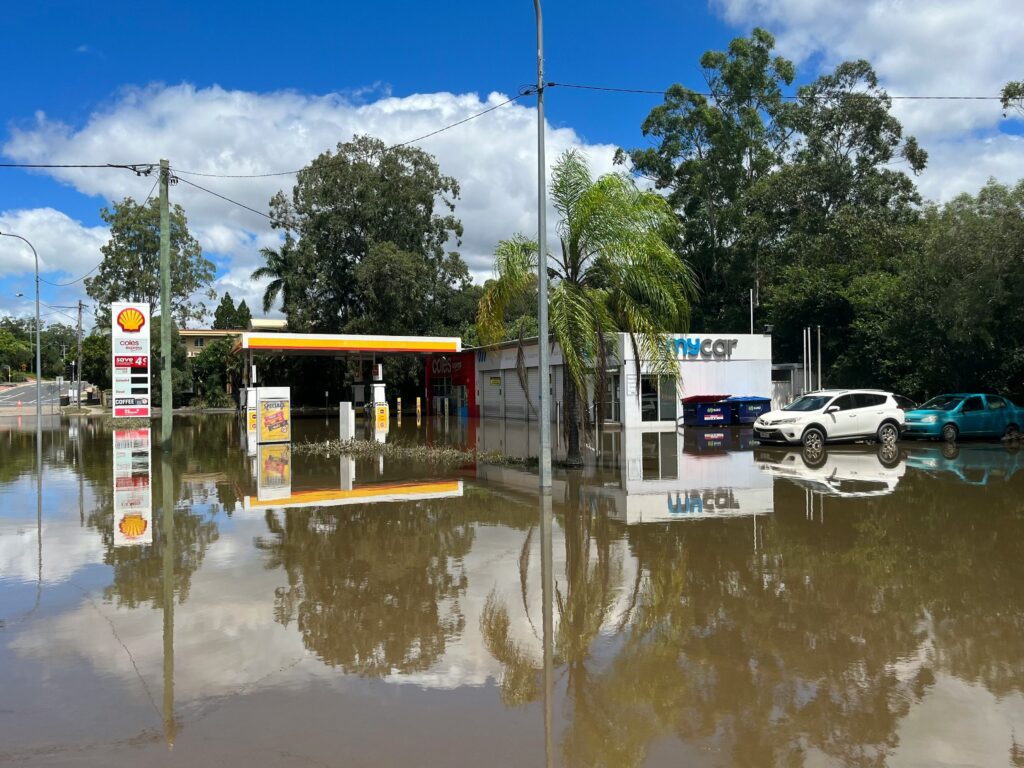
Flood maps are essential because flood risk is one of the most overlooked factors when buying rural or semi-rural property in Australia. A block might look perfect in summer with dry paddocks and a scenic creek, but historical flood data can tell a very different story. Australia’s diverse terrain and flood history mean that checking official flood maps is essential before you buy, build, or develop land. This guide covers the free, government-supplied flood mapping tools available across Australia and explains what they can reveal about property risk. While these tools aren’t legal or insurance advice, they give you the baseline information you need to make informed decisions.
Why Flood Maps Are Important for Property Buyers
Flood history directly affects insurance premiums, finance approval, and property values. Many banks require flood certificates or additional assessments before lending on properties in known flood zones. Insurance companies use flood mapping data to set premiums, and in some high-risk areas, flood cover may not be available at all or comes with significant excesses.
What’s less obvious is that many properties outside official flood zones can still experience surface flooding, especially during extreme weather events. Low-lying areas, properties near watercourses, or land with poor drainage can flood even when they’re not marked on council maps. Early flood checks help buyers avoid unexpected infrastructure costs, building restrictions, or the financial burden of flood-proofing structures after purchase. Understanding flood risk upfront means you can factor it into negotiations, budget for mitigation measures, or decide to walk away from a problem property.
National Flood Mapping Resources
Geoscience Australia Flood Studies Database
Geoscience Australia maintains the Australian Flood Studies Database through the Australian Flood Risk Information Portal (AFRIP). This database contains over 1,500 references to flood studies and maps completed up until 2018, providing comprehensive metadata on flood behaviour across Australia. Each study includes details about the commissioning organisation, lead consultant, watercourses covered, flood assessments, and mitigation recommendations.
While AFRIP is maintained as a historical record and hasn’t been updated with new studies since 2018, it remains a valuable resource for understanding past flood investigations. The portal provides flood study summaries, technical reports, and where available, digital flood maps. You can access the database at www.ga.gov.au/flood-study-web, though for the most current flood information, you should cross-reference with state-specific portals and local council flood studies.
Australian Flood Risk Information Portal (AFRIP)
The interactive AFRIP map allows you to search for flood studies by location, view study extents, and download available flood data. It’s useful for comparing regional flood risk information and identifying whether formal flood studies have been completed in your area of interest. The portal shows which areas have been studied, the type of flood events modelled, and links to detailed reports where ownership has been established.
Keep in mind that the absence of a flood study doesn’t mean there’s no flood risk. It simply means formal modelling hasn’t been completed or hasn’t been contributed to the national database. Always check with local councils and state agencies for the most recent flood assessments.
State-Based Flood Maps and Tools
New South Wales – NSW Flood Data Portal
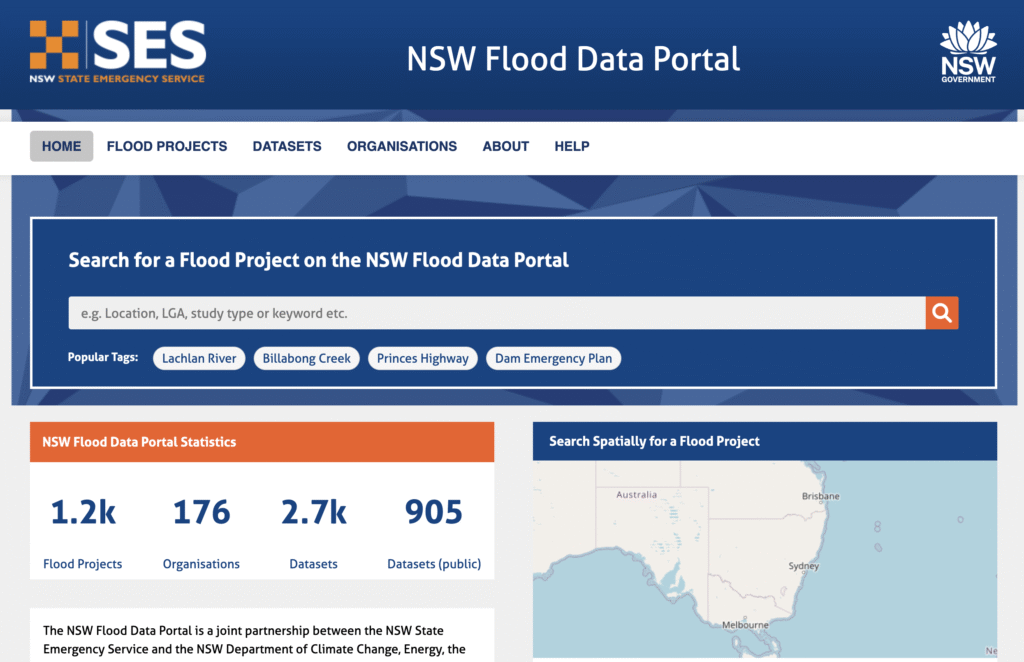
The NSW Flood Data Portal is a joint partnership between NSW State Emergency Service and the NSW Department of Climate Change, Energy, the Environment and Water. The portal provides access to flood studies, floodplain risk management studies, plans, and associated data from around the state. Local councils add data to the portal, allowing flood information to be shared across government agencies and stakeholders.
You can access the portal at flooddata.ses.nsw.gov.au. The NSW SES also provides Local Flood Insights, which offer detailed maps, historical flood event data, and community stories about flooding impacts in specific catchment areas. These tools help you understand not just whether a property might flood, but how flooding has affected communities in the past and what evacuation routes might be available.
For property-level flood information, contact your local council directly, as they remain the primary source of detailed flood data for their service areas. Council flood studies often include Flood Planning Levels, which indicate the height to which development should be designed to avoid flood damage.
Queensland – FloodCheck Online Mapping
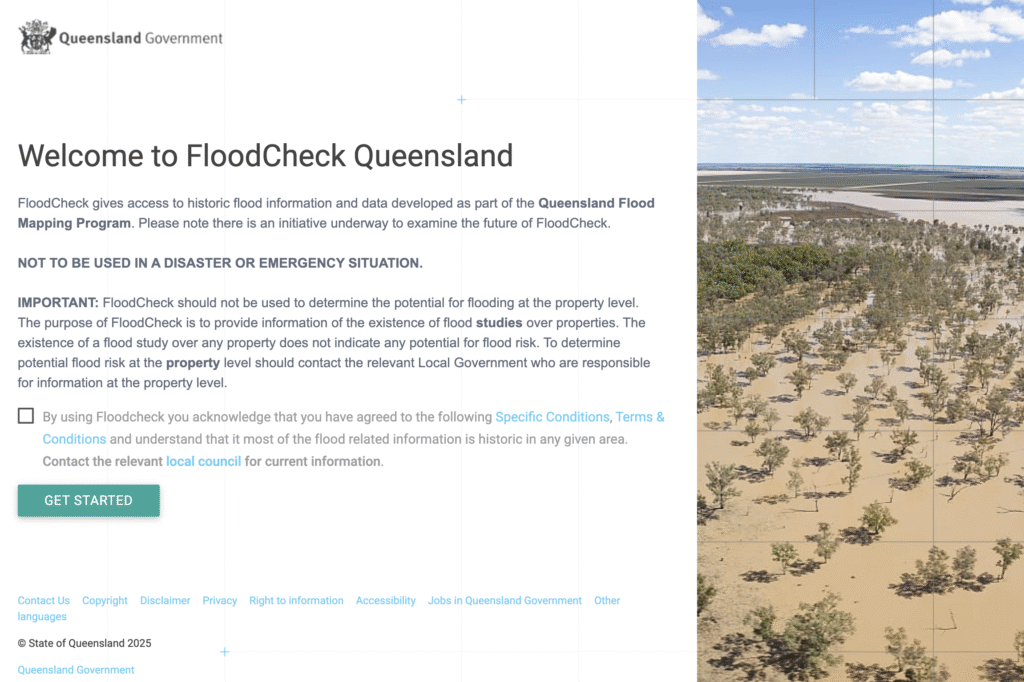
FloodCheck Queensland is a web map application managed by the Department of Resources that provides information on floodplains, modelled flood maps, historical flood events, and technical reports. The interactive map includes the Queensland Floodplain Assessment Overlay (QFAO), which shows the likely extent of floodplains across the state, and historical floodlines from major events in 1893, 1974, 2010, and 2011.
Access FloodCheck at floodcheck.information.qld.gov.au. The tool is intended for regional-scale understanding of flood behaviour and should not be used to determine property-level flood risk. For specific property assessments, contact your local council. Queensland councils maintain their own flood maps and data, and many provide interactive mapping tools on their websites. FloodCheck is particularly useful for checking watercourse proximity and understanding whether formal flood studies exist for your area.
Note that there is an initiative underway to examine the future of FloodCheck, so verify current access when you use it.
Victoria – VicPlan Flood Overlays
In Victoria, flood planning controls are managed through the planning scheme system and displayed via VicPlan, the state-wide planning map. Flood overlays in Victorian planning schemes include the Land Subject to Inundation Overlay (LSIO), Floodway Overlay (FO), and Special Building Overlay (SBO). These overlays indicate where land may be subject to flooding and where development restrictions apply.
You can access VicPlan at vpa.vic.gov.au/vicplan to view flood overlays for any Victorian property. The Department of Energy, Environment and Climate Action (DEECA) works with local councils and water authorities like Melbourne Water to produce and update flood mapping. Individual councils also maintain detailed flood studies for their municipalities, which provide more specific information than state-wide overlays.
For comprehensive flood assessments, check both VicPlan and your local council’s planning portal. Some catchment management authorities, like West Gippsland CMA, also provide community flood portals with detailed local information.

South Australia – WaterConnect
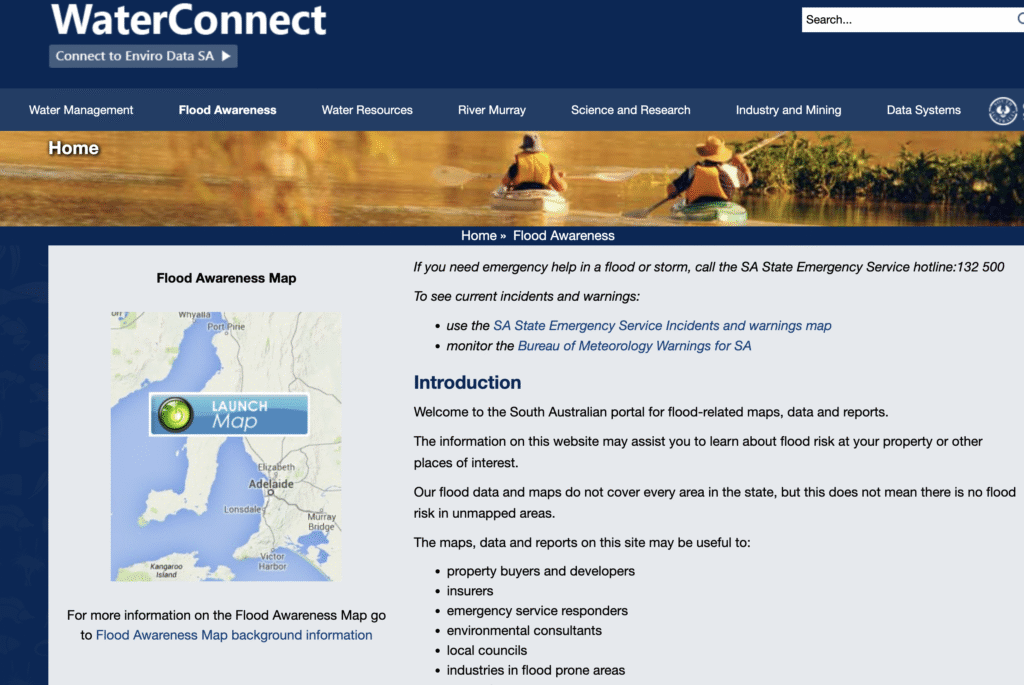
South Australia‘s WaterConnect system provides access to flood awareness mapping and floodplain data through the Department for Environment and Water. The Flood Awareness Map allows you to search by address or property location to view flood risk information where studies are available.
Access WaterConnect’s flood mapping at www.waterconnect.sa.gov.au/Systems/FAM. The system includes flood study extents, inundation mapping, and downloadable spatial data. Not all areas of South Australia have completed flood studies, so the absence of mapping doesn’t mean flood risk doesn’t exist. Contact your local council or the Department for Environment and Water for site-specific flood advice.
South Australia has completed significant flood hazard mapping projects in recent years, addressing climate change impacts and development growth. This updated mapping is being progressively incorporated into the Planning and Design Code through the state’s SAPPA (South Australian Property and Planning Atlas) portal.
Western Australia – DWER Floodplain Mapping
The Western Australian Department of Water and Environmental Regulation (DWER) produces floodplain mapping for major rivers and watercourses across the state. The floodplain mapping tool displays 1 in 100 year (1% annual exceedance probability) flood events, which are used as the standard for land use planning.
Access the interactive mapping tool at www.wa.gov.au/service/natural-resources/water-resources/floodplain-mapping-tool. The mapping covers major river systems including the Swan and Canning Rivers, Avon River, Blackwood River, and many regional watercourses. For site-specific flood advice beyond what the mapping tool provides, contact DWER at flood@dwer.wa.gov.au.
Western Australia‘s floodplain mapping focuses on high-risk coastal and inland zones where development pressure is highest. The maps show floodways (where significant flow occurs) and flood fringes (areas inundated but with lower velocities), which have different development controls.

Tasmania – Tasmanian Strategic Flood Maps
Tasmania’s State Emergency Service developed the Tasmanian Strategic Flood Maps (TSFM) to provide broad, regional-scale understanding of flood risk across the state. The maps cover most of Tasmania and show flood extent, depth, velocity, and hazard for different probability flood events, including 2%, 1%, and 0.5% annual exceedance probability events, as well as climate change projections for 2100.
Access the flood maps through LISTmap, Tasmania’s Land Information System, at www.thelist.tas.gov.au. The SES website at www.ses.tas.gov.au/floodmaps provides detailed guidance on interpreting the maps and understanding flood risk. Local council flood studies, where available, provide more detailed information than the strategic maps and should be consulted for property-level assessments.
The Tasmanian flood maps focus on riverine flooding but only partially cover stormwater runoff flooding from heavy local rainfall. Some municipalities, like Glenorchy City Council, maintain their own detailed flood maps for urban stormwater systems. Check with your local council to see if more detailed studies are available for your area.
Northern Territory – NT Floodplain Mapping
The Northern Territory government provides floodplain mapping for key towns and communities through the Department of Environment, Parks and Water Security. Floodplain maps are available for areas including Darwin, Katherine, Alice Springs, Tennant Creek, and other regional centres.
Access flood information at nt.gov.au/environment/water/water-in-the-nt/flooding-and-storm-surge. The NT also provides flood monitoring data through the Bureau of Meteorology and the NT Water data portal, showing real-time river levels and rainfall. Storm surge inundation maps are also available for coastal areas, which is particularly important for properties in cyclone-prone regions.
For property-specific flood information, contact your local council or the NT Department of Environment. Floodplain mapping coverage in the NT is more limited than in southern states, so local knowledge and historical flood records become even more important in assessing risk.

How to Read a Flood Map Correctly
Understanding flood map terminology is essential for interpreting risk accurately. Flood events are typically described using Annual Exceedance Probability (AEP), which replaced the older Annual Recurrence Interval (ARI) terminology. A 1% AEP flood (previously called a 1 in 100 year flood) means there’s a 1% chance of that flood level or higher occurring in any given year. This doesn’t mean floods happen on a predictable 100-year cycle. Two major floods can occur in consecutive years, or a century can pass without one.
Flood maps distinguish between different zones within the floodplain. A floodway is the river channel and the portion of floodplain where significant water flow or storage occurs. Blocking a floodway, even partially, can raise flood levels and affect areas that weren’t previously flooded. Development in floodways should be avoided wherever possible. The flood fringe is the area that floods but doesn’t carry significant flow velocity. Development may be permitted in flood fringes with appropriate controls. Flood storage areas hold water during floods, and filling or developing these areas can displace floodwater to neighbouring properties.
Colour codes on flood maps typically indicate depth or hazard levels, with darker colours showing deeper water or higher hazard. Check the map legend carefully, as colour schemes vary between jurisdictions. Planning overlays like Victoria’s LSIO, FO, and SBO, or Queensland’s flood planning overlays, trigger specific development controls. Properties within these overlays may require council approval for works, higher floor levels for buildings, or specific flood mitigation measures.
Using Flood Maps for Property Due Diligence
Start by cross-checking flood zones with Google Earth or aerial imagery to understand topography and natural drainage patterns. Look at where the property sits relative to watercourses, low points in the landscape, and neighbouring land. Historical flood extents often correlate with visible terrain features like old river channels or depressions in paddocks.
Compare flood mapping with soil and elevation data for additional context. Clay soils in low-lying areas are more prone to waterlogging, while sandy, elevated sites drain better. Council GIS systems often layer flood data with contour maps, which helps you visualise how water moves across the landscape.
Before purchasing, ask the local council for the latest flood study reports, even if maps are available online. Reports contain critical information about flood depths, velocities, evacuation routes, and the assumptions used in modelling. Some councils provide property flood certificates that summarise flood levels and planning requirements for specific addresses. These certificates can be valuable for finance applications and insurance assessments.
Don’t rely solely on official flood maps. Talk to neighbours, local emergency services, and long-term residents about their flood experiences. They often know which roads flood first, where water backs up, and how quickly conditions can change. This local knowledge complements formal flood studies and helps you understand real-world flood behaviour.
Limitations of Flood Maps
Flood map accuracy varies significantly depending on when the underlying study was completed and what methodology was used. Some maps are based on studies from the 1980s or 1990s, while others incorporate recent climate data and modern hydraulic modelling. Always check the publication date of the flood study supporting the maps you’re viewing. Outdated studies may not reflect current conditions or recent development that’s altered drainage patterns.
New developments, particularly large subdivisions or industrial estates, can change local runoff patterns by increasing hard surfaces and concentrating stormwater. Flood maps created before these developments may not account for the additional water being directed into drainage systems or natural watercourses. Infrastructure changes like new levees, bridges, or road embankments can also affect flood behaviour in ways that older maps don’t capture.
Satellite imagery and flood photography can supplement official flood models by showing where water actually went during historical events, but they can’t replace formal hydraulic modelling. Photos show what happened under specific conditions on a particular day but don’t predict future flood behaviour or show flood depths and velocities. Official flood models, despite their limitations, provide the most reliable basis for development decisions and insurance assessments.
Climate change is making historical flood patterns less reliable as predictors of future risk. Increased rainfall intensity, more frequent extreme weather events, and changed seasonal patterns mean that areas previously considered low risk may face higher flood exposure in coming decades. Some modern flood studies include climate change projections to 2050 or 2100, but many older studies don’t account for these factors.
Summary: Checking Flood Risk Before Buying or Building
Flood maps are an essential first step in assessing land risk, but they’re not the only step. Use flood mapping to identify potential issues early in your property search, then follow up with detailed council flood studies, professional surveys, and on-ground inspections. The combination of official mapping, local knowledge, and expert advice gives you the most complete picture of flood risk.
For properties in or near mapped flood zones, consider engaging a qualified engineer or surveyor to assess specific risks and recommend mitigation options. Raising floor levels, installing flood barriers, or relocating critical infrastructure can significantly reduce flood damage potential, but these measures add cost and complexity to development.
Remember that flood mapping tools show where flooding is possible based on historical data and modelling, not where it’s guaranteed to occur. Low-risk areas can still flood under extreme conditions, and high-risk areas might go decades without a major event. The goal is to understand the risk profile of your property so you can make informed decisions about purchase price, insurance, development design, and long-term viability.
Frequently Asked Questions
Yes, most flood maps are publicly available through federal and state government portals at no cost. The Australian Flood Risk Information Portal, state flood mapping tools, and most local council flood studies are accessible online without registration fees. Some councils may charge for detailed property flood certificates or site-specific assessments, but the underlying flood mapping data is generally free to view.
Accuracy varies significantly depending on the age of the underlying flood study, the quality of terrain data used, and how much ground-truthing was done during the study. Modern flood studies using LiDAR elevation data and recent hydraulic modelling are generally more accurate than older studies based on limited surveying. Always check the publication date of the flood study. Maps based on studies from the 1980s or 1990s may not reflect current development patterns or climate conditions. For critical decisions, seek site-specific advice from qualified engineers or your local council.
A 1 in 100 year flood, now more commonly described as a 1% annual exceedance probability (AEP) event, refers to a flood level that has a 1% chance of being equalled or exceeded in any given year. It’s a statistical probability, not a prediction that floods occur every 100 years. Multiple major floods can happen in quick succession, or decades can pass without one. The 1% AEP flood has approximately a 50% chance of occurring at least once during a 70-year period, which is why it’s commonly used as the basis for floodplain management planning.
Insurance companies use similar data but often combine government flood maps with their own proprietary risk modelling and historical claims data. They may have access to more recent flood information or use different flood probability scenarios than those shown on public maps. Some insurers use finer-scale modelling that accounts for individual property characteristics like building height, materials, and flood mitigation measures. This is why two neighbouring properties might receive different insurance quotes despite being in the same mapped flood zone.
In many cases, yes, but you’ll typically need council approval and may require engineering solutions to mitigate flood risk. Requirements vary by state and by the severity of flood risk. Development in floodways is generally prohibited or heavily restricted, while development in flood fringes may be allowed with conditions such as raised floor levels, flood-proof construction, or specific building materials. Some councils require minimum floor levels above the 1% AEP flood level plus freeboard (typically 300-500mm). Obtaining approval often requires a flood impact assessment prepared by a qualified engineer, demonstrating that your development won’t increase flood risk to neighbouring properties and that the building will be safe during design flood events.

